
Intel Advisor is an optimization tool that helps the developers identify hot spots, performance issues and also provide recommendations for performance improvement. It has been installed at most of the Princeton research computing systems. Intel Advisor was part of the licensed Parallel Studio XE (PSXE) releases before. It is now included in the Intel OneAPI base toolkit, which is free to download. In this article, we will walk you through the process of collecting performance data remotely at Princeton Research Computing clusters using the Intel Advisor command line interface (CLI) and displaying the results on a local macOS system using the Intel Advisor graphical user interface (GUI).
Preparing Applications for Performance Analysis
For C/C++ and Fortran code (on Linux OS), it is recommended to setup the following compiler flags before running the performance analysis:
- Request full debug information (compiler and linker): -g
- Request moderate optimization: -O2 or higher
- Disable inter procedural optimization that may inhibit the profiler to collect performance data: -no-ipo
- Produce compiler diagnostics: -qopt-report=5
- Enable OpenMP directives: -qopenmp
See: https://software.intel.com/content/www/us/en/develop/documentation/advisor-user-guide/top.html
Using Intel Advisor on Princeton Research Computing Clusters
Before, we usually recommended that you used the CLI to collect data via batch jobs at compute nodes and then viewed results using the GUI on a login node. Now as the Intel Advisor GUI is available free on macOS, we recommend that you copy the collected data from the remote system to your local macOS to view. Note Intel Advisor does not support data collection on macOS and you can only use macOS for displaying the data collected on a Windows or Linux OS.
Collecting Data at Remote System
Once in a remote system (e.g., Tigercpu, Adroit etc), you start by loading the module, e.g., module load intel-advisor. Then you can collect the data using the Intel Advisor CLI. The CLI is launched with advisor command. You can use advisor –help to search for the command for a specific action. For example, after issuing advisor –help command, you will see
Intel(R) Advisor Command Line Tool
Copyright (C) 2009-2020 Intel Corporation. All rights reserved.

 Usage: advisor <--action> [--action-option] [--global-option] [[--] <target>
 [target options]]

<action> is one of the following:

    collect          Run the specified analysis and collect data. Tip: Specify the search-dir when collecting data.
    command          Issue a command to a running collection.
    create-project   Create an empty project, if it does not already exist.
    help             Explain command line actions with corresponding options.
    import-dir       Import and finalize data collected on an MPI cluster.
    mark-up-loops    After running a Survey analysis and identifying loops of interest, select loops (by file and line number or criteria) for deeper analysis.
    report           Generate a report from data collected during a previous analysis.
    snapshot         Create a result snapshot.
    version          Display product version information.
    workflow         Explain typical Intel Advisor user scenarios, with corresponding command lines.

For help on a specific action, type: advisor --help <action>

Examples:

 Perform a Survey analysis.

 	advisor --collect=survey --project-dir=./advi --search-dir src:r=./src -- ./bin/myApplication

 Generate a Survey report.

 	advisor --report=survey --project-dir=./advi --search-dir src:r=./src

 Display help for the collect action.

 	advisor --help collect
advisor –help collect shows you the command to perform a specific analysis. For example, to perform a survey analysis to determine hotspots, we use
advisor --collect=survey --project-dir=./advi --search-dir src:r=./src -- ./bin/myApplicationTo collect the roofline, you can run a tripcounts analysis on top of the above survey analysis. Note the project directory needs to be the same for both analyses.
advisor --collect=tripcoutns -flop --project-dir=./advi --search-dir src:r=./src -- ./bin/myApplicationIntel Avisor version 2021.1 provides a roofline analysis option to integrate the earlier two steps roofline collection in a single step.
advisor --collect=roofline --project-dir=./advi --search-dir src:r=./src -- ./bin/myApplicationNote it is recommended to NOT use –no-auto-finalize option for reducing collection and finalization time if the data will be reviewed on a local macOS later since the macOS might have a different version of compiler, runtimes, math libraries and other parts of analyzed application stack (see: https://software.intel.com/content/www/us/en/develop/documentation/advisor-cookbook/top/analyze-performance-remotely-and-visualize-results-on-macos.html).
It is also helpful to use the GUI to find out the command. For example, you can:
- Log in a remote head node with ssh -Y usersname@adroit.princeton.edu
- Load the module with module load intel-advisor
- Launch the Intel Advisor GUI with advisor-gui
- Create a project
- Set up the project properties
- Choose the appropriate analysis type
- Click the get command line button on the workflow tab under the desired analysis
- Copy the command line to clipboard to paste to the script for remote runs
To view the results, you can copy the whole project directory to your local macOS. It is also recommended to first pack the analysis results in a snapshot and then copy the packed *.advixeexpz file. For example:
advisor --snapshot --project-dir=./advi --pack --cache-sources --cache-binaries -- ./advi_snapshotViewing Results on a Local macOS System
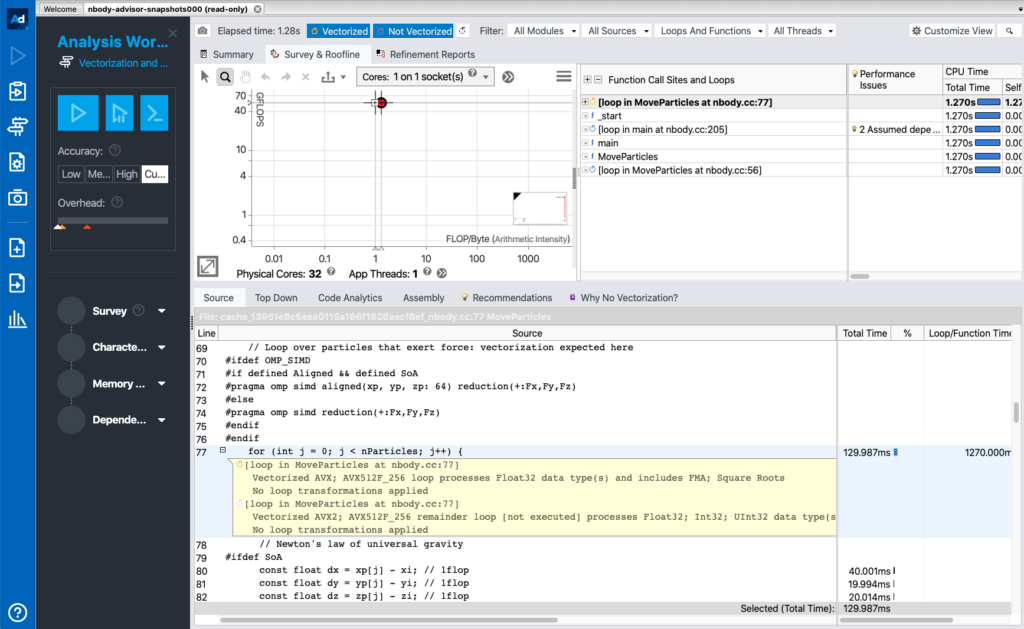
You can download the Intel Advisor for macOS from the oneAPI base toolkit. After launching the Intel Advisor GUI, you then go to File > Open > Project/Result and navigate the copied project directory/snapshot.
This article covers the following NEW in Intel Advisor version 2021.1:
- Intel Advisor is included as part of the Intel OneAPI base toolkit
- The executables are renamed. advixe-cl is renamed to advisor. advixe-gui is renamed to advisor-gui
- The roofline analysis is provided as a single command. In the earlier version, roofline analysis is done by first running a survey analysis followed by a tripcounts analysis. Now we can run the roofline in a single step using —collect=roofline option.
For a complete list of new update, please see https://software.intel.com/content/www/us/en/develop/documentation/advisor-user-guide/top/what-s-new.html.
References: