
I started working as a research software engineer for the Princeton Neuroscience Institute (PNI) in May 2017. At the end of my first week I received an email from Professor Mala Murthy and post-doc David Deutsch of the MurthyLab, asking if I would be interested in working on a project involving a “virtual reality environment for neural recording experiments”. The kid in me got very excited at the prospect of making video games. At the time I did not know the project was to develop a virtual reality simulation for flies!
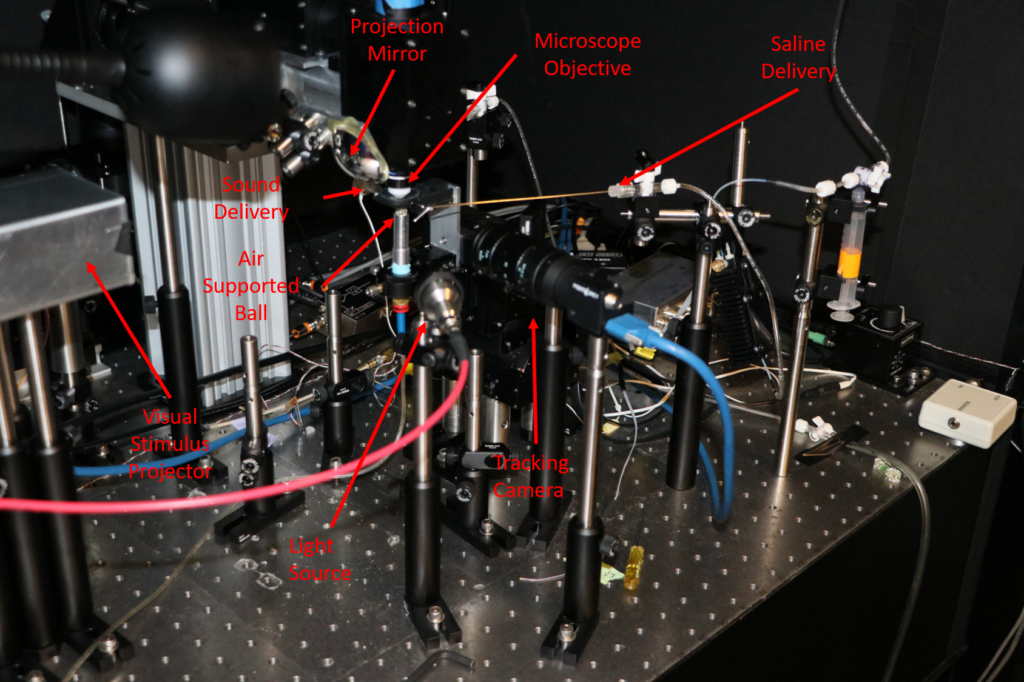
Virtual reality experiments have a long history in neuroscience . They allow researchers to restrict the movement of animal subjects so that they can use advanced microscopy to image their brains in “naturalistic” environments. In the Murthy lab’s VR setup, the fly is fixed to the objective of a two photon microscope and suspended above a small sphere floating on a column of air. This small sphere is used as a sort of omni-directional treadmill. While the fly cannot actually move, it can move its legs, which in turn move the freely rotating sphere. The movement of the sphere is tracked with computer vision algorithms and thus a fictive path for the fly in a virtual world can be reconstructed. This setup allows a “moving” fly’s brain to be imaged with techniques that require it to be stationary. The two photon imaging system then provides a very flexible and powerful tool for studying changes in the fly’s brain activity over time of the experiment. Different spatial and temporal resolutions are available depending on the needs of the experimenter.
The imaging is orchestrated via separate standalone computer running ScanImage, an open-source MATLAB software application for laser scanning microscopy. The two-photon microscope and ScanImage software are triggered for imaging by sending simple stop, start, and next file (record samples in a new TIFF file) trigger signals to a data acquisition device (DAQ) that forwards it to the microscope hardware.
Motion Tracking
The motion tracking component of the FlyVR system is built around a publicly available software called FicTrac developed by Richard Moore. FicTrac is a small C++ code that processes images of the rotating ball and determines its instantaneous rotation frame by frame. It does this utilizing fairly standard old-school computer vision algorithms. The ball is patterned with a random black and white texture. A global texture map of the ball is built up over time as it rotates. The software models the textured sphere and uses nonlinear optimization methods to try and find the best rotation of the textured sphere model to align it with the current image frame. From the rotation of the sphere frame by frame, the fly’s fictive motion on a 2D plane can be derived. These computations can be computed in real-time using frames recorded from a USB camera or offline from a video file.
When I began working on the project the researchers were mostly using FicTrac in an offline batch mode, processing videos that they captured during “open loop” experiments. Here the term open loop is used to mean that the stimuli presented to the fly are predetermined and the fly behavior has no effect. Additionally, the original version of FicTrac only supported Ubuntu Linux and most of the setups the researches used were windows machines. This forced them to run the software in a virtual machine. This impacted tracking performance which was not a concern when running things in batch mode but was very important in the closed loop setup the researchers were trying to build for FlyVR. The number of frames per second (FPS) that could be tracked in real time was an important consideration and researchers were targeting at least 100 FPS. Higher FPS also increases the tracking accuracy because the software is able to integrate smaller rotation changes between frames better than larger ones. So one of my first tasks was to port the FicTrac software to windows. To simplify this process I built FicTrac using MSYS2, a POSIX compatibility layer built to inter-operate with windows. This allowed me to rewrite only a small part of the core program. The hardest part was actually getting some of FicTrac’s dependencies setup in MSYS, libraries such as OpenCV and nlopt.
With a working windows port of FicTrac, the next step was deciding how to stream the real time tracking data to the other components of FlyVR. We wanted the core FlyVR software to be written in Python. There are many ways to handle interprocess communication between C++ and Python (sockets, file system, shared memory, etc.) FicTrac supported socket and serial output out of the box but its implementation had some limitations. In the end, since we could ensure that the FlyVR core software would run on the same machine as FicTrac we decided that a very simple shared memory approach would work best. FicTrac was modified to setup a small region of shared memory to store the current tracking state variables. As each frame is processed the tracking state is updated in this shared memory region. Boost.Interprocess was used to implement this. On the Python side, we poll this shared memory region for updates and invoke a callback whenever the state is updated.
Since we developed this solution the author of FicTrac released a version 2.0 with windows support. Our current setup is still using FicTrac version 1.0 but in preparation for moving to FicTrac version 2.0 we have released a version of our python closed loop interface as a standalone software package called Python Ball Motion Tracking, or pybmt. In this implementation, we have replaced the shared memory approach with a socket based approach using ZeroMQ. Both our windows port of FicTrac version 1.0 and the pybmt package (built for FicTrac version 2.0) are being used by other labs outside of Princeton for their closed loop setups.
Auditory Stimuli System
Acoustic Pattern Recognition and Courtship Songs: Insights from Insects
Christa A. Baker, Jan Clemens, Mala Murthy
Annual Review of Neuroscience 2019 42:1, 129-147
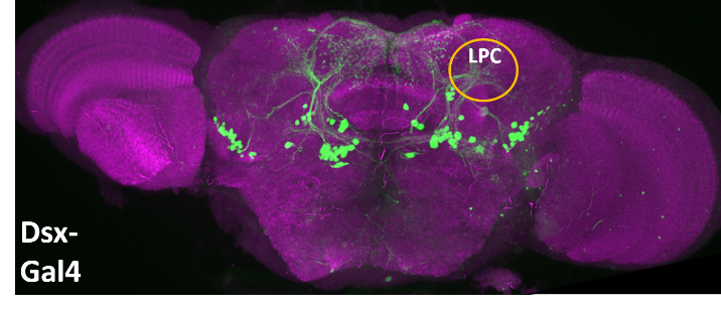
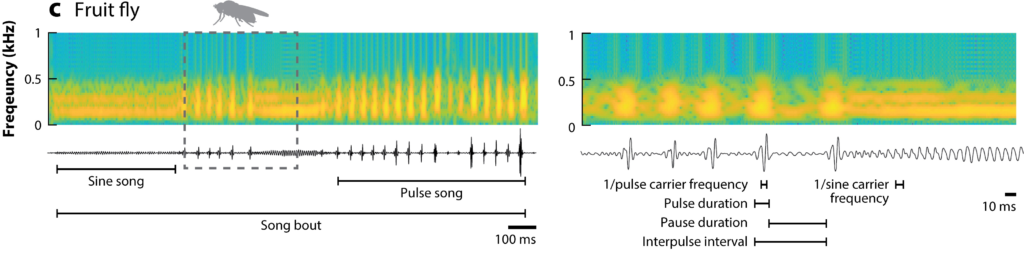
The auditory system is probably the most mature and capable part of the VR simulation at the moment. The Murthy lab has extensively studied the courtship rituals of male and female flies. Male flies produce songs for female flies by beating their wings. The Murthy lab has recorded and studied their songs and constructed models to simulate male songs in response to female behavior. One potential experiment would allow a simulated male fly to produce songs in response to the real female fly’s motion in the fictive environment. This type of “closed loop” experiment is technically very challenging because the software must track the motion of the real fly, feed that data into the model of male fly to determine the auditory response, and deliver the auditory stimuli all with low latency.
In the past, most of their open loop experiments would involve delivering preconfigured “playlists” of auditory stimuli to a fly under the microscope. These experiments would use a National Instruments™ 6323 X Series Data Acquisition Device (DAQ) for both delivering the auditory stimuli and recording the experimental signals. The sample rate of the auditory signal is 10 kHz and the signal is fed through a mono channel earbud headphone with an extending tube to deliver the sound directly to the fly’s antennae. The auditory setup is calibrated so that amplitudes delivered to the fly are comparable to actual recorded fly songs.
In these open loop experiments, the fact that the auditory stimulus is predetermined is advantageous. In a predetermined experiment the fly’s behavior cannot influence the auditory stimulus so the entire buffer of audio data can be prepared well in advance to playback. However, the inherent goal of a closed-loop FlyVR setup requires that the generation of auditory stimuli be influenced in real time by the behavior (tracked motion) of the fly. This makes audio output latency a key consideration for the system. The NI 6336 DAQ is very good at delivering the 10 kHz audio signal and recording multiple input signals in a synchronized and reliable manner. However, it is a device that is inherently designed for high sample rate and multi-channel throughput. Thus, it has large software and hardware buffers for these signals and does not permit changing the audio output data with low latency. There are certain “modes” for the device which do allow this but they do not work for our needs. For example, there is a singlepoint output mode where a software loop on the controlling machine is required to provide a single audio sample per iteration. This would work well in theory but leads to problems with the sample rates above 1000 Hz. In addition, Windows is not a real time OS that can provide tight timing bounds on this loop so when the process is preempted we get audio buffer underruns. National Instruments does provide alternative solutions that allow writing LabView programs that run on a separate real time OS but this would place limitations on the other software components of FlyVR.
Instead, we decided to go with a fairly low tech solution. Modern audio cards are designed for low latency audio output. In fact, the integrated audio card in most of the labs machines was already capable of round trip audio latencies of under 10 ms. The roundtrip latency is measured by starting a timer, sending an audio signal out of the card and routing it back directly in for recording, stopping the timer when the signal is detected. Professional grade audio cards can achieve 1-2 ms roundtrip latencies. The cards achieve this by using low latency drivers and keeping the buffers smaller. Output latency is very important for interactive games and musicians. To interface with the audio card we used Python bindings for the wonderful portaudio library.This didn’t require many changes to the software because audio waveform generation code was made very modular and separated from the actual sound server code. The current version of FlyVR supports audio output via the DAQ for open loop experiments and via the on-board PC soundcard for closed loop experiments.
Closed Loop Latency Testing
In order to measure the closed loop latency from end-to-end we devised a simple test experiment. By end-to-end latency, I mean the time it takes for a fly change in movement to be tracked\detected on the ball, feed into the core FlyVR “game loop”, and audio output to be generated in response to some decision. This is latency includes the audio output latency but also other components like tracking and the mechanical delay of the motor. To measure this we devised a simple experiment in which we replaced the moving real fly with a programmable Arduino and stepper motor to rotate the ball. The balls rotation was fixed to rotate at two different speeds for equal time in a periodic manner. We developed a simple tracking response model to detect the change in speed and immediately play sound during high speed phase and turn it off during the low speed phase. The ball control signal and the audio output were both recorded at 10 kHz on the same DAQ. With both the audio signal and the control signal being recorded on the same device synchronization issues we eliminated and we could compare the delay between ball motion change and onset and offset of audio playback.
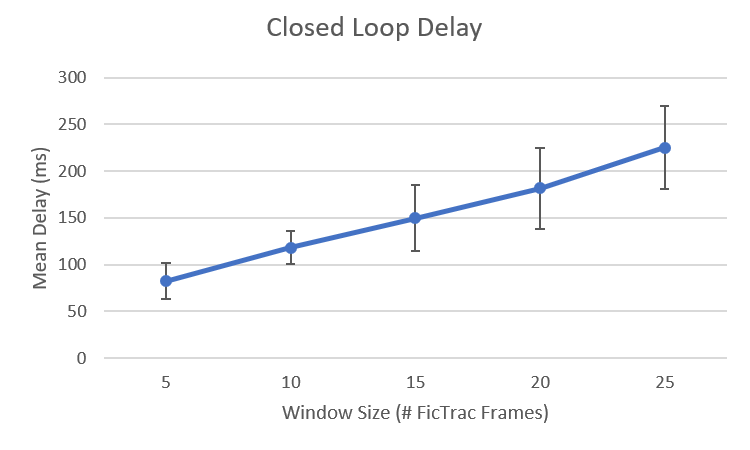
In this process, we learned that the dominant source of latency for auditory output was not the audio card but the tracking latency. While the tracking system is running a 100Hz the signal can be quite noisy. To smooth the signal we must take a moving window over approximately 10 to 15 frames in order to get reliable estimates of the current speed of the ball. This tracking delay, combined with audio output latency and mechanical latency of the motor lead to a total end-to-end delay of around 100 ms. While this is acceptable for certain experiments we are looking at ways to lower this latency. Possible approaches are to increase the frame rate of the camera and tracking system without increasing noise but these are open problems.
Next Time …
That is enough for now. In a later post I will discuss the visual stimulus system which is being developed mainly by another post-doc in the MurthyLab, Adam Calhoun. In addition, I will discuss synchronization and data recording challenges between all of the various components.